Last week balance
PEI irrigation report
Victoria
Weekly irrigation outlook for Potato at Victoria. Last recorded station day: 2026-05-26.
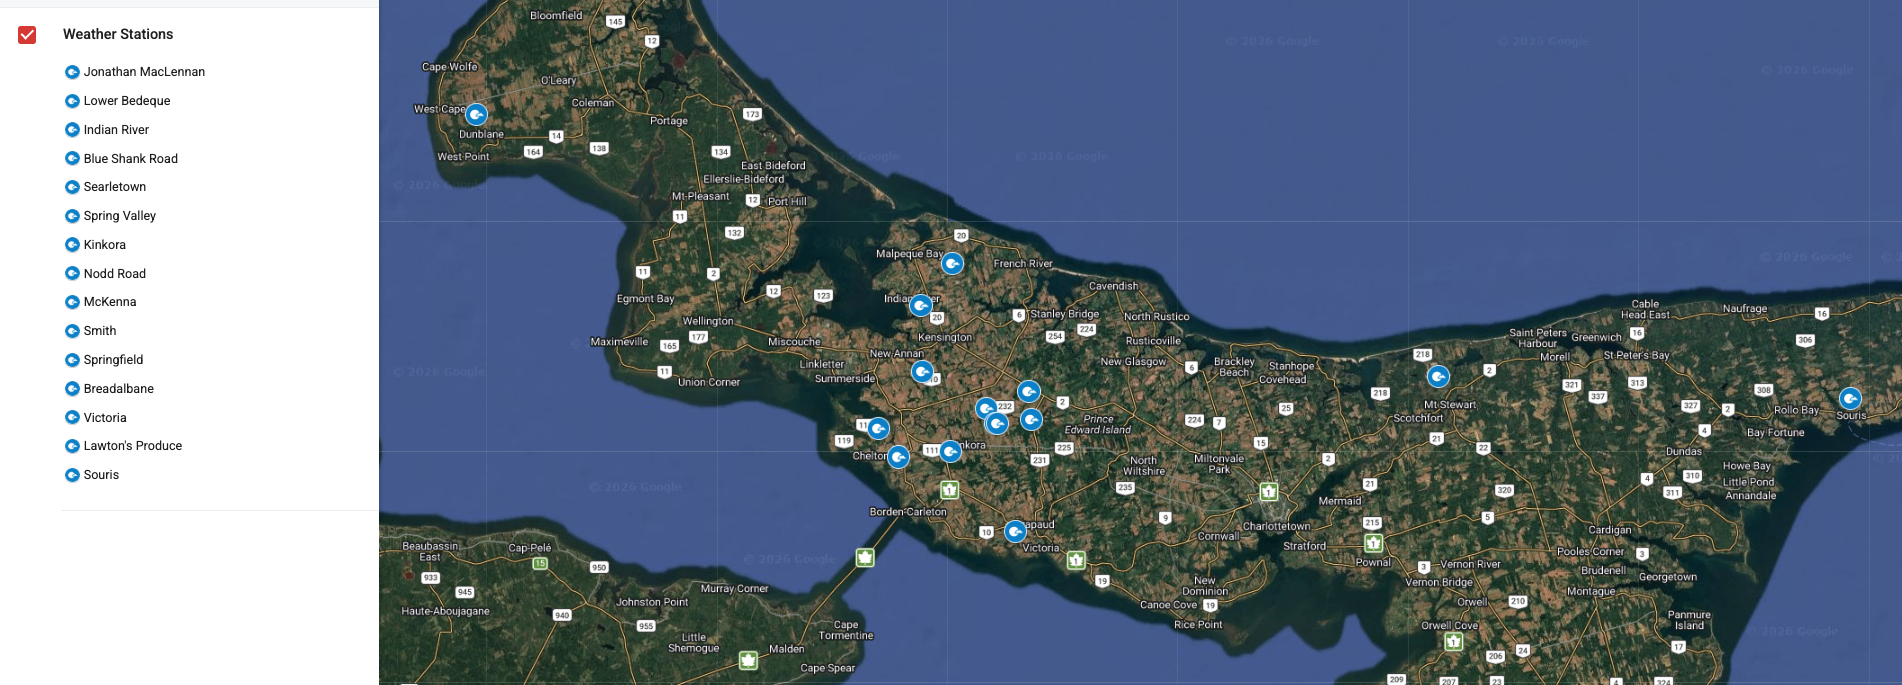
PEI station map

Potato heat units since planting
Set planting date
Current moisture
29.3%
Water content
32.4%
Electrical conductivity
n/a
Soil status
Saturated / wet
Soil moisture guide
Use these % VWC ranges as a quick grower-facing guide when reviewing soil moisture on the station pages.
| Moisture Status | % VWC | What It Means for Your Crop |
|---|---|---|
| Severely Dry | < 13% | The soil is running on empty and potatoes are stressed. |
| Moderately Dry | 13-17% | Soil moisture is getting low and should be watched closely. |
| Optimal | 17-23% | Just right for healthy potato growth. |
| Full (Field Capacity) | 23-25% | The soil is full of water but not yet saturated. |
| Saturated / Wet | > 25% | Too much water and drainage or drying time may be needed. |
Weekly water balance
Weekly rain and irrigation compared with crop water use, so you can see where the field likely gained or lost moisture.
Showing full season
Weekly rain
Weekly ETc
Surplus 0.0 mm
Deficit 0.0 mm
Weekly summary table
Use this table to compare weekly rainfall and irrigation against estimated crop water use. You can change the growth stage and irrigation directly in the table.
| Week Ending | Growth Stage | Crop | Mean Temp | Mean Solar | Rain | Irrigation | Total Input | ETo | ETc | Weekly P-Days | Season P-Days | Weekly GDD | Season GDD | Surplus/Deficit | Reserve | Depletion | Refill | Avg VWC | Avg Water Content | Avg EC |
|---|
Saved Field Irrigation Plans
Save the current planting date, growth-stage, and irrigation setup with a name, then load it later for this station.
Using the farm default growth-stage schedule.
| Plan Name | Planting Date | Saved | Changed Weeks | Actions |
|---|
How to use this report
Rain plus irrigation gives total water in. That total is compared with estimated crop water use to show whether the field likely ran a weekly surplus or deficit.
ETo is the reference evapotranspiration estimate. ETc is crop evapotranspiration, which applies the crop-stage factor for the current growth stage so the estimate is more field-relevant for potatoes.
This report supports three models: corrected Hargreaves, FAO-56 Penman-Monteith, and a sensor-based water balance. Hargreaves is the simpler temperature-driven estimate, Penman-Monteith is the standard weather-driven method, and Sensor uses field moisture response where enough data exists.
Corrected Hargreaves form used in this report
ETo = 0.0023 x (Tmean + 17.8) x sqrt(Tmax - Tmin) x Ra
Ra is extraterrestrial radiation estimated from PEI latitude and day of year. Penman-Monteith uses station solar radiation, humidity, and wind when present. The sensor model estimates reserve, depletion, and refill from soil moisture response and rainfall plus irrigation.
Growth stage follows the station calendar unless you change it in the table or save a field irrigation plan with its own planting date. When a planting date is chosen, the report automatically treats the two prior weeks as Pre-Plant.
- Sensor model field capacity is estimated from the wetter plateau weeks in the station record, currently about 31.1% VWC.